• About me

The Library of Tomorrow

~ thoughts and reflections on the world of Library and Information Science

The Library of Tomorrow

Tag Archives: Voyant Tools

Self-reflection through DITA data analysis

09 Tuesday Dec 2014

Posted by Dominic in Information Architecture

≈ 5 Comments

Tags

data visualisation, DITA, Elena Villaespesa, Ernesto Priego, information architecture, text analysis, Twitter, Voyant Tools, WordPress

Well, after ten lectures, ten lab sessions and one reading week, the taught element of the DITA module is now over, with only the assignment left to complete and hand in. Before I started this module, a blog post reflecting on my experience would have been entirely qualitative—a simple description of my enjoyment of blogging and Tweeting, despite my previous hesitancy and even scepticism. However, if there’s one overarching theme that I’ve taken away from this module, it’s that everything I do online (and offline as well, for that matter) can be broken down into quantifiable data and be analysed using a variety of suitable tools. So, what better way to conclude my blog posts on this module by using some of these techniques on my own digital output?

Twitter
Let’s start with Twitter. From looking at my profile page, I can see that I (at the time of writing) have tweeted on 174 occasions, am following 177 accounts, have 77 followers, and have favourited 104 tweets. I can also scroll through each individual tweet that I have sent in order to see how many times (if any) it was retweeted or favourited by others. This is all very basic.

However, Twitter also provides its users with an analytics service, which—in addition to providing more detailed statistics pertaining to the above criteria—also provides a count of Impressions (defined as “the number of times users saw the tweet on Twitter”), Engagements (defined as “the total number of times a user has interacted with a tweet. This includes all clicks anywhere on the tweet[…]retweets, replies, follows, and favorites”), and the Engagement Rate (the number of Engagements divided by the total number of Impressions) for each individual tweet. For instance, this popular tweet about the course’s Christmas party yesterday evening has (so far) received 113 impressions and 62 engagements, giving an engagement rate of 54.9%. No doubt these figures will continue to change, especially as I have just interacted with it again in order to embed it in this post!

#citylis after party! pic.twitter.com/tOi9xsi6HN

— Dom Allington-Smith (@domallsmi) December 8, 2014

It is easy to see how Twitter Analytics can be of use to anyone with an account, especially those run by companies and institutions that are seeking maximum engagement with potential consumers. The detailed statistical information available allows the controller of the account to see what kind of tweets receive the most attention; for instance, those which include photos, links, or jokes.

As with several other websites that I have previously covered in this blog, Twitter analytics also allows for the raw data associated with the Twitter feed to be exported as a Comma Separated Values (csv) file into a spreadsheet for further analysis. (The data for my account is viewable here.) The spreadsheet—in the lab session yesterday we used an open-access template developed by Elena Villaespesa with the Tate and modified by Ernesto Priego—can then be used for further analysis. (Again, the data is viewable here For instance, it orders the top tweets by engagement rate for each month, so I can easily see that my top tweet for October was an advert for my earlier blog post on information retrieval—

My thoughts on yesterday's #dita lab experiment on searching techniques in information retrieval. http://t.co/iylT763KkM #citylis

— Dom Allington-Smith (@domallsmi) October 14, 2014

—and that my top post in November was a joke I made during the British Library Labs Symposium (although this has been influenced by the fact that I appear to have accidentally favourited my own tweet, a definite social media faux pas).

First it was the @MechCuratorBot , now @VictorianHumour 's Mechanical Comedian – how long before we get a Mechanical Librarian? #citylis

— Dom Allington-Smith (@domallsmi) November 3, 2014

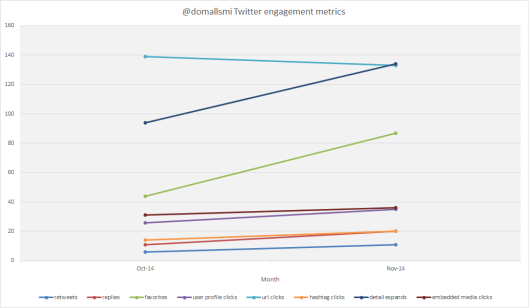
I can also use the figures to produce suitable visualisations: for instance, this breakdown of different types of Twitter interactions between October and November indicates an overall upward trend (31% according to the figures) driven largely by people favouriting my tweets and clicking on them to view more details on more occasions.

domallsmi Twitter engagement Oct-Nov

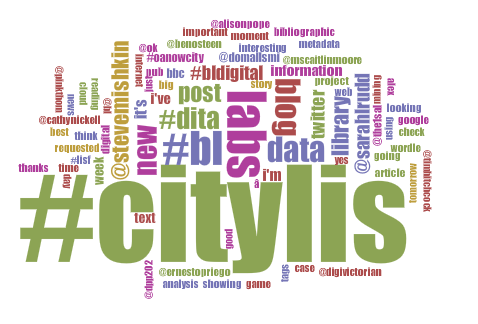
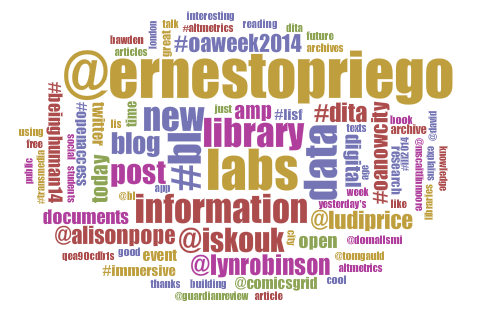
The raw data itself can also be subjected to text analysis: the Voyant Tools wordcloud quickly and intuitively reveals the hashtags I have used most often (no prizes for guessing that #citylis dominates!) and the users with whom I have had the most interactions.

voyant cirrus twitter domallsmi

WordPress
The other main facet of my self-expression this term has been this blog. Again looking at the most basic raw data, I can see that I have published 13 posts (not including this one), and that the blog has 33 followers, has been commented on 28 times (although many of these are my own pingbacks to previous posts), and has been viewed 898 times (this last figure is viewable by anyone as a widget at the foot of the page).

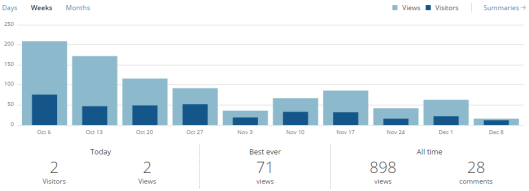
WordPress also provides an analytics page which allows bloggers to track metrics such as page views, referrals to the site, and links clicked on. So, for example, I can track the blog’s popularity over time, with reference to when I published certain posts (interestingly enough, the leanest period so far coincides with reading week!).

WordPress views

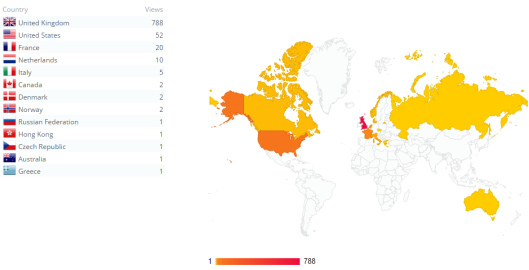
I can also see the global reach of the blog by viewing the geographical location by country of visitors displayed on a world map (I’m surprised by some of these!).

WordPress GIS

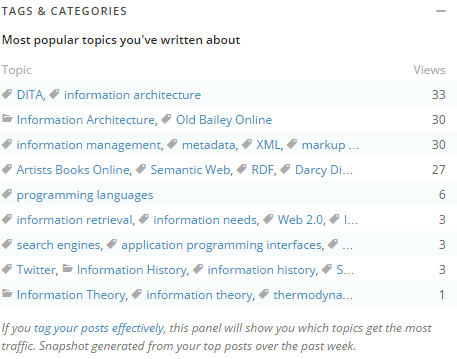
And as a final example, I can see which tags and categories are particularly possible. As with the Twitter case above, this could allow me to expand my readership as I could focus on the more interesting subjects. Unfortunately this feature only extends back one week.

WordPress tags

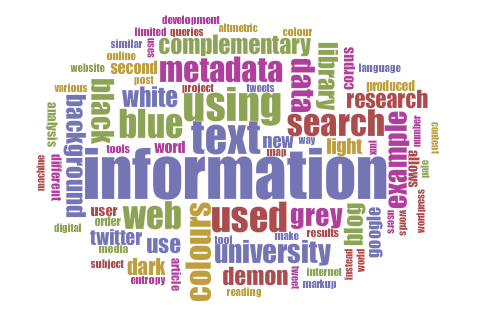
Unlike Twitter analytics, I cannot find a way to export this information for further analysis. However, I can copy-and-paste the content of each post to produce a Voyant word cloud.

voyant cirrus wordpress

Whilst “information” is unsurprisingly the dominant topic, the prominence of numerous colour-related terms is less immediately explainable, and requires me to think back to this early post on the blog’s design and colour scheme Similarly, anyone puzzled by the appearance of the word “demon” in a blog about Library and Information Science should refer to this post on information theory with special reference to Maxwell’s Demon. As ever, data mining and text analysis, understood as forms of “distant reading”, must be further investigated by close reading and an understanding of context, although they do provide good starting-points for research and identification of underlying patterns.

Conclusion
I have very much enjoyed using both Twitter and WordPress, and I believe that the examples above help to illustrate my engagement on the former platform, and my diverse range of readers and subjects covered on the latter. I have also enjoyed the module as a whole, despite not coming from a technical background: it has been extremely useful to understand the basic technological principles (and, stemming from them, the wider socio-cultural implications) that underlie the work of the contemporary information professional.

I will definitely keep this blog running, although I imagine that the posting schedule will become less frequent and regular, particularly with Christmas coming up and assignment deadlines looming. On the other hand, it may also begin to cover a wider range of material. I can imagine, for example, that the blogging process will be very helpful in organising my thoughts when it comes to writing my dissertation later in the academic year. For now, though, thanks for reading, and please stay tuned for further posts!

To finish with, here is some suitably reflective music for you to enjoy.

At the coalface of information

25 Tuesday Nov 2014

Posted by Dominic in Information Architecture

≈ 3 Comments

Tags

application programming interfaces, Big Data, Christiaan Huygens, data mining, data visualisation, datasets, Digital Humanities, DITA, Franco Moretti, Google Books, information architecture, information law, Old Bailey Online, programming languages, search engines, text analysis, Voyant Tools, Zotero

After last week’s experiments with word clouds and other forms of text analysis, our class took a step back yesterday to look at the wider implications of data mining (of which text analysis is a subset). These include questions of representation and of legality—for example, should data mining be exempt from copyright laws, allowing researchers to access full texts of copyrighted works in order to feed them through computer programmes and applications, with only the general conclusions being made available to the public instead of full individual texts?

Google Books’s ongoing digitisation project is a good example of the legal challenges involved; the associated website includes a brief (and self-justifying!) outline. It is worth bearing in mind that the aims of this particular project go beyond data mining, but one of the most visible outcomes is the creation of the Google Books Ngram Viewer, a tool which allows anyone to search the entire corpus of digitised material for certain words or phrases, in order to find out their levels of incidence (a technique given the name “n-gram”). The viewer covers the years 1800 to 2008 and incorporates corpora in various languages. The total number of books in the various corpora was 5.2&nsbp;million in 2012 and is growing rapidly; it still represents a small fraction of the total number of texts published or still available, but one that is becoming ever-increasingly representative of this total. Some institutions, such as the Royal Dutch Library (Koninklijke Bibliotheek) have also used the tool’s API to create their own “mashups”—in this case, a Dutch-language version of the tool with its own corpus.

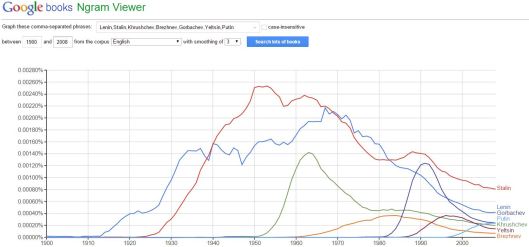
The Google Books Ngram Viewer can be used, in a manner similar to word clouds, to provide a quick and easy-to-understand overview of the criteria searched for. For example, this search of the most notable leaders of the Soviet Union/Russian Federation since the October Revolution in 1917 produces the following results from Google’s English corpus, showing rapid rises for each new leader as he assumed power, followed by either sustained or transient interest thereafter. One can easily imagine a humanities scholar using the tool as a starting-point for further research (perhaps using the further links to precise listings within Google Books that are conveniently placed underneath the generated graph!).

Google Books Ngram Viewer Russian leaders

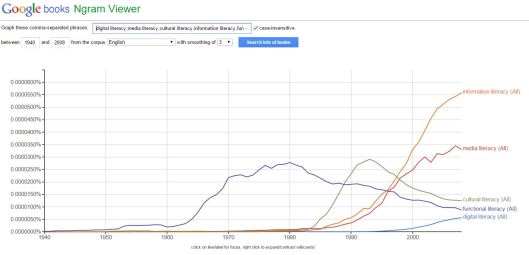
The tool can also be useful for LIS research: this graph shows the n-gram trends for several literacy concepts that we discussed in our Foundation module last week.

The graphs can also be embedded using an API, but not in WordPress.com thanks to its limited HTML functionality!

The graphs can also be embedded using an API, but not in WordPress.com thanks to its limited HTML functionality! (Please click to enlarge.)

Many of the institutions and publishers that do collaborate with Google perhaps do so reluctantly, unwilling to take on a corporate behemoth of such immense proportions. However, there are many examples of research projects in which the corpus, data mining and text analysis are carried out with much greater co-operation. One of these is Old Bailey Online, a project funded and otherwise supported by a variety of institutions and sources, which provides a digital archive of the court’s proceedings between 1674 and 1913. The website has a search engine, but also an API Demonstrator, which allows the results of interrogations of the database to be exported to the reference management system, Zotero, and the Voyant Tools suite of applications for data visualisation which I used last week.

It is therefore possible to carry out complex searches, analyse the results at a superficial level (yet one that can identify key research questions), before going through particularly interesting texts within the corpus in more detail. This is conventional “close reading”; the newer methods of data mining and text analysis have been referred to as “distant reading” by the digital humanities scholar, Franco Moretti.

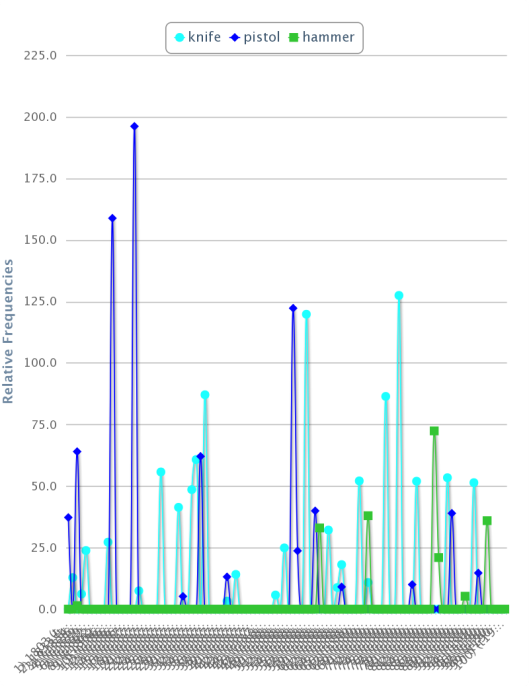
One of the reasons for making the archive publicly available is so that those with an interest in genealogy can research their family history; sadly, my almost-unique surname restricts me from carrying out a search based on such principles without further research into my family history! Nevertheless, a search of the complete archive for cases in which someone was found guilty of “wounding”, but also found to be “insane”, produced a corpus which I was able to visualise using a number of methods: for example, in addition to the word clouds covered last week, I produced a graph showing the incidence of different weapons commonly used in the corpus of cases (which is listed in chronological order).

The keywords can then be further analysed with a collocation tool, and by close reading in the corpus reader.

The keywords can then be further analysed with a collocation tool, and by close reading in the corpus reader.

During this process, I noticed that the integration between Old Bailey Online and Voyant Tools was particularly impressive: the export interface was extremely easy to use, and the common English stopwords list was applied automatically (which is not the case if the text is entered manually, as was the case last week).

Some research projects take this process a stage further, and create their own customised data mining and data visualisation tools to integrate all aspects of the project within the same digital framework. Although this takes a significant amount of work, it also produces potentially the most convenient and “future-proof” (in the sense that a project does not have to rely upon an external partner). The Dutch Utrect University currently has several text-mining research projects listed on its Digital Humanities website. Unfortunately, many of them are still in the early stages of development and do not provide access to the data being used, but a good example is the Circulation of Knowledge and Learned Practices in the 17th-century Dutch Republic (CKCC) project, whose corpus comprises 20,000 letters sent between seventeenth-century scholars (mostly) resident in the Dutch Republic.

The project, again funded by grants from an assortment of sponsors, is clear in its aims:

One of the main targets of this project is to create free, online access to historical sources, open to researchers from various disciplines all over the world. Unlike earlier printed editions of correspondences, this source is not static but of a highly dynamic nature, making it possible for the scholarly community to discuss problems, share information and add transcriptions or footnotes. One of the great advantages of this project is its ability to invoke new questions, new interpretations and new information, and to bring all this together on an expanding website.

To this end, the project’s website includes a Virtual Research Environment (VRE)—the ePistolarium—which allows anyone to search the corpus and produce visualisations from the data produced. The search engine offers a plethora of options: one can search by sender, recipient (or combine the two), people named in the letter, geographical location of sender or recipient, and date. There is also an algorithm that allows for a similarity search, whereby letters are ranked and retrieved based on similarities within the text.

A search for the complete correspondence available of Christiaan Huygens—one of the most prominent and well-represented individuals within the corpus—produces a list of results which can be ordered using six different criteria: date, sender, recipient, sender location, recipient location, and text search score (if performing a free text search in the body of the letters). The transcribed contents of each individual letter can also be read, along with its associated metadata, important keywords, and similar texts that are retrieved using the aforementioned similarity search tool. Each letter can also be sent to an e-mail address, or be shared on Facebook or Twitter, but unfortunately there are no permalinks as yet. The search results as a whole can also be exported as a CSV (Comma Separated Values) file, for those who may wish to perform their own further analysis.

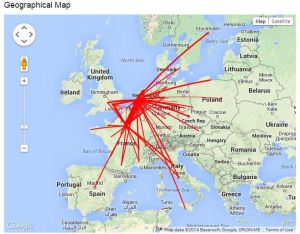
This would appear to be unnecessary, however, as the project has several different data visualisation tools that are fully integrated with the VRE. (The output for each visualisation is also available to download in JSON format, although it is not yet possible to embed any of them using an API.) The first of these is a map, in which the geographic location metadata associated with each letter is used to plot lines between senders and recipients on a map, in this case the correspondence of Huygens:

CKCC Huygens map

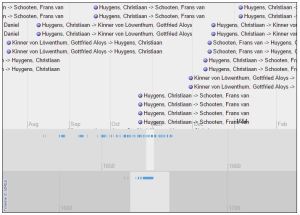
A movable timeline, in three different scales, allows the user to view patterns of Huygens’s correspondence in chronological order:

CKCC Huygens timeline

A network visualisation shows all the individuals to whom Huygens sent letters, and from whom he received them.

CKCC Huygens correspondence

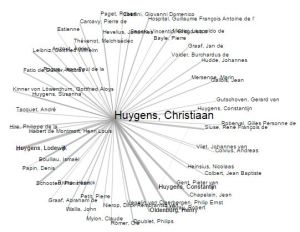
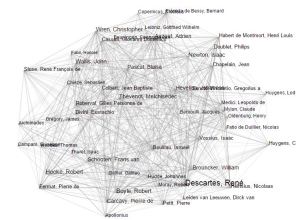
Finally, a “cocitation graph” shows the names of individuals, contemporary or otherwise, who feature in the correspondence. I believe that this visualisation is of the greatest value, as it allows us to view those who could be described as the intellectual influencers of Huygens and his peers, and acts as a useful starting-point for further research on this topic, which would involve close reading of the letters themselves. The project’s website includes a page of initial research experiments conducted with the tool.

CKCC Huygens cocitation

(Committed readers of this blog may notice a certain similarity between these latter two visualisations and those produced by the TAGS Explorer tool that I wrote about some weeks ago.)


It is clear from my own experience with these projects, and the topics that I have covered in previous blog posts, that the “distant reading” of large-scale datasets through various forms of data mining is a crucial part of contemporary humanities research. Our role as information professionals must therefore be to fully understand these tools and technologies in order to further advance the knowledge that can be produced, or at least assisted in producing, by them throughout academia and the wider world. It is worth noting once more, however, that these techniques should be used to supplement traditional research, so we must also endeavour to keep our feet on the ground whilst doing so.

Screwing around with text analysis

18 Tuesday Nov 2014

Posted by Dominic in Information Architecture

≈ 5 Comments

Tags

Altmetric, altmetrics, data visualisation, datasets, Digital Humanities, DITA, Geoffrey Rockwell, infographics, information architecture, information overload, Jacob Harris, Julie Meloni, Stefan Sinclair, Stephen Ramsay, TAGS, text analysis, Twitter, Voyant Tools, Wordle

The title of this blog post is not flippant, but is in fact taken from a chapter of a recently-published book, entitled The Hermeneutics of Screwing Around; or What You Do with a Million Books, by Stephen Ramsay. Ramsay discusses how the concept of epistemological order—in his words, the “coherent, authoritative path through what is known”—has evolved over time, and recently been completely transformed entirely by the emergence and insatiable growth of the Internet. The essential premise of our current situation is that there now is far too much information, even on the most specialised subjects, for any one person to take in during his or her lifetime; however, new digital technologies allow us to explore the information in alternative ways.

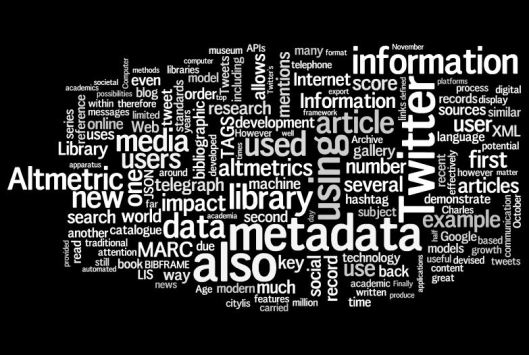
One of these ways is text analysis. This involves feeding a corpus, or body, of text(s) through a computer programme in order to discover various conclusions that would not be apparent at first glance, or would otherwise have been prohibitively expensive and time-consuming to be carried out by human effort alone. For instance, a basic method of text analysis is counting the frequency of words that appear in a text; the information, which only takes a few seconds to compute, even for a corpus of thousands of words, can be displayed visually in the form of a word cloud. The word cloud currently produced by the RSS feed of this blog (which excludes the older posts) looks like this:

All apparently on-topic for a LIS student!

All apparently on-topic for a LIS student!

This word cloud was produced by Wordle, a widely-known and well-used JavaScript tool that performs this very basic level of text analysis. Wordle in fact refers to itself as a “toy” rather than a “tool”, but it provides a firm foundation for those getting involved in these methods for the first time. Indeed, Julie Meloni refers to it as “the gateway drug to textual analysis” in her blog post on the application’s uses in an education environment. Wordle’s addictiveness is enhanced by the fact that it is customisable at an aesthetic level—the colours, font and basic layout of the cloud can all be changed (hence the colour scheme to match my blog theme).

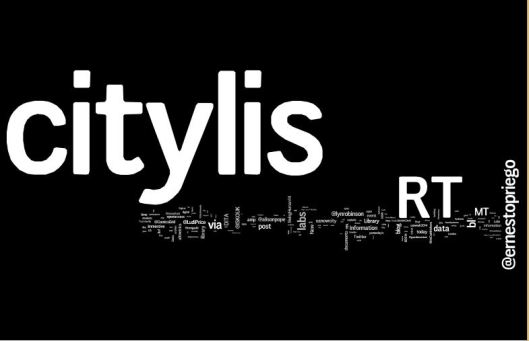
Wordle, however, is limited in other ways. I can demonstrate this by using the archive of data that I began exporting from Twitter a few weeks ago using TAGS (which has since been growing, as additional Tweets matching the criteria are automatically added every hour). Feeding the corpus consisting of the Tweets (all of which feature the hashtag #citylis, remember) into Wordle produces this word cloud (using exactly the same aesthetics as before):

#citylis wordle

This unwelcome result has occurred because of Worldle’s customisation limitations. Text analysis normally makes use of stopwords—extremely common words such as “the”, “a”, “and” and so forthwhich are not included in the computation. Wordle’s default stoplist does omit these words, but it cannot be edited to suit the needs of each individual word cloud; hence, this one is (as you would expect) dominated by the hashtag “citylis” that links the dataset together, whilst other Twitter jargon such as “RT” (retweet) and “MT” (modified tweet) is also visible.

Fortunately, other, more advanced, tools exist for text analysis. The best of those that I have come across so far is Voyant Tools (initially given the unfortunate name of Voyeur Tools), which is still under development by its creators, Geoffrey Rockwell and Stefan Sinclair, but offers significantly more options. Using the same citylis corpus and removing the unwanted stopwords produces a more meaningful visualisation, which clearly shows the most prolific Tweeters and the most common other hashtags used:

#citylis stopwords removed voyant

Unlike Wordle, the colours, fonts etc. cannot be modified.

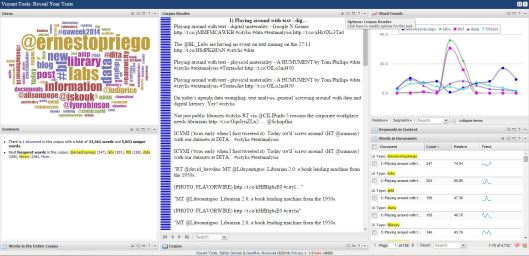
Voyant’s tools also extend beyond the word cloud, including a full text reader, a word trends graph, and the ability to locate individual words and see them in context (known as collocation), as can be seen from the screenshot of the entire interface below. This has the potential for more extensive meaningful analysis: for example, looking at the word trends graph, it is clear that there is a spike in activity for the words “lab” and “#bl”—my classmate, Daniel van Strien, explains why here. Another of my classmates, Rachel Giles, has also used Voyant’s ability to customise stopwords to produce more meaningful information about her dataset of cancer-related health journal articles from Altmetric.

There are additional tools not visible in this screenshot, or in development.

There are more tools not visible in this screenshot, or in development.

This is only barely scratching the surface of text analysis, and I will post more on the subject next week as we explore the closely related technique of text mining. What is particularly exciting about text analysis is that it lends itself best to humanities research due to its focus on the written word, but is the complete opposite of the traditional “close-reading” approach due to its use of large datasets. These disciplines have traditionally been exclusively qualitative in nature, and so using what is a quantitative method to analyse the source material has the potential to open up a new wealth of opportunities for research and data visualisation, collectively known as the Digital Humanities. One interesting and freely-accessible example is this The Lord of the Rings project, which has analysed the complete text of the novel (plus J.R.R. Tolkien’s other works in some cases) to produce a range of relevant infographics.

However, I will nevertheless end on a note of caution. Analysing information in this way risks losing the context that underlies it, and visually appealing infographics such as word clouds can be used when they are not necessary at the expense of a more informative presentation, as Jacob Harris demonstrates with a comparison using the same dataset. As with several other aspects of this module, therefore, I would advise that this technique is used to supplement more traditional methods of achieving the same end, not to replace them.

#citylis blogs

  • CityLIS blog
  • David Bawden
  • Ernesto Priego
  • Ludi Price
  • Lyn Robinson

Posts by category

  • General (5)
  • Information Architecture (9)
  • Information History (3)
  • Information Management (1)
  • Information Organisation (1)
  • Information Society (12)
  • Information Technology (1)
  • Information Theory (2)

Follow me on Twitter

My Tweets

Common Tags

Altmetric altmetrics Analogue Internet application programming interfaces authority control BIBFRAME Big Data censorship Charles Ammi Cutter City University London Creative Commons databases data manipulation data mining datasets data visualisation digital divide Digital Humanities disruptive innovation DITA Ernesto Priego event reports Fun Palaces Google Google Scholar Henri La Fontaine housekeeping information architecture information behaviour information futurology information history information law information management information needs information organisation information overload information retrieval information society information technology information theory JSON LAPIS Lawrence Lessig Library education library OPACs Library qualifications Library school LibraryThing MARC markup languages Matt Finch Memex metadata Mundaneum museums Old Bailey Online Open Access Paul Otlet programming languages public libraries search engines Semantic Web social media TAGS text analysis Twitter Universal Decimal Classification user experience Vannevar Bush Voyant Tools Web 2.0 website design Wikipedia WordPress XML

#citylis student blogs

  • Ali
  • Alison
  • Amy
  • Caitlin
  • Cathy
  • Chris
  • Clyden
  • Daniel
  • David
  • Eleanor
  • Elena
  • Emma
  • Eve
  • Fengchun
  • Gordon
  • Hannah
  • Hannie
  • Harkiran
  • Ian
  • Iro
  • Isobel
  • James
  • Jamilah
  • Joanna
  • Judith
  • Julie
  • Kathryn
  • Kristina
  • Lamar
  • Lisa
  • Maryam
  • Matthew
  • Melissa
  • Naama
  • Neil
  • Nicole
  • Pablo
  • Rachel
  • Richard
  • Russell
  • Saidah
  • Sal
  • Sarah B.
  • Sarah R.
  • Scott
  • Shermaine
  • Steve
  • Tom
  • Wendy
  • Yee Xin

Blog archives

Blog Stats

  • 10,408 hits

Recent Comments

Anime roundup 6/29/2… on A Demon of the Second Kind: St…
A voyage of Discover… on Anticipating the dissertation:…
Serendipity and zine… on If you go down to the library…
Visiting the Mundane… on Reductio ad Wikipedia?
Visiting the Mundane… on Anticipating the dissertation:…

Copyright

Creative Commons License
This work is licensed under a Creative Commons Attribution-ShareAlike 4.0 International License.

The cover image (Orion Nebula) was taken by NASA/ESA, and is in the public domain. Source: Wikimedia Commons.

Create a free website or blog at WordPress.com.

Cancel
Privacy & Cookies: This site uses cookies. By continuing to use this website, you agree to their use.
To find out more, including how to control cookies, see here: Cookie Policy