Tags
data visualisation, DITA, Elena Villaespesa, Ernesto Priego, information architecture, text analysis, Twitter, Voyant Tools, WordPress
Well, after ten lectures, ten lab sessions and one reading week, the taught element of the DITA module is now over, with only the assignment left to complete and hand in. Before I started this module, a blog post reflecting on my experience would have been entirely qualitative—a simple description of my enjoyment of blogging and Tweeting, despite my previous hesitancy and even scepticism. However, if there’s one overarching theme that I’ve taken away from this module, it’s that everything I do online (and offline as well, for that matter) can be broken down into quantifiable data and be analysed using a variety of suitable tools. So, what better way to conclude my blog posts on this module by using some of these techniques on my own digital output?
Twitter
Let’s start with Twitter. From looking at my profile page, I can see that I (at the time of writing) have tweeted on 174 occasions, am following 177 accounts, have 77 followers, and have favourited 104 tweets. I can also scroll through each individual tweet that I have sent in order to see how many times (if any) it was retweeted or favourited by others. This is all very basic.
However, Twitter also provides its users with an analytics service, which—in addition to providing more detailed statistics pertaining to the above criteria—also provides a count of Impressions (defined as “the number of times users saw the tweet on Twitter”), Engagements (defined as “the total number of times a user has interacted with a tweet. This includes all clicks anywhere on the tweet[…]retweets, replies, follows, and favorites”), and the Engagement Rate (the number of Engagements divided by the total number of Impressions) for each individual tweet. For instance, this popular tweet about the course’s Christmas party yesterday evening has (so far) received 113 impressions and 62 engagements, giving an engagement rate of 54.9%. No doubt these figures will continue to change, especially as I have just interacted with it again in order to embed it in this post!
It is easy to see how Twitter Analytics can be of use to anyone with an account, especially those run by companies and institutions that are seeking maximum engagement with potential consumers. The detailed statistical information available allows the controller of the account to see what kind of tweets receive the most attention; for instance, those which include photos, links, or jokes.
As with several other websites that I have previously covered in this blog, Twitter analytics also allows for the raw data associated with the Twitter feed to be exported as a Comma Separated Values (csv) file into a spreadsheet for further analysis. (The data for my account is viewable here.) The spreadsheet—in the lab session yesterday we used an open-access template developed by Elena Villaespesa with the Tate and modified by Ernesto Priego—can then be used for further analysis. (Again, the data is viewable here For instance, it orders the top tweets by engagement rate for each month, so I can easily see that my top tweet for October was an advert for my earlier blog post on information retrieval—
—and that my top post in November was a joke I made during the British Library Labs Symposium (although this has been influenced by the fact that I appear to have accidentally favourited my own tweet, a definite social media faux pas).
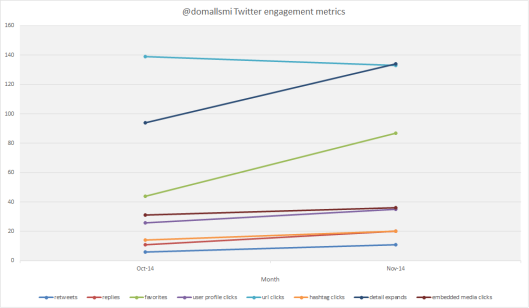
I can also use the figures to produce suitable visualisations: for instance, this breakdown of different types of Twitter interactions between October and November indicates an overall upward trend (31% according to the figures) driven largely by people favouriting my tweets and clicking on them to view more details on more occasions.
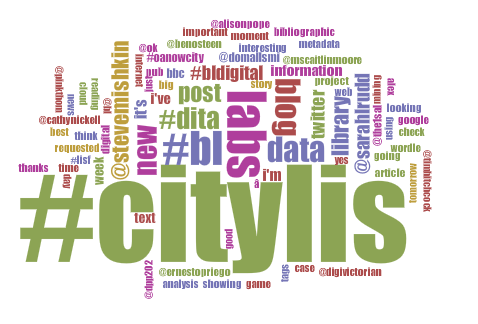
The raw data itself can also be subjected to text analysis: the Voyant Tools wordcloud quickly and intuitively reveals the hashtags I have used most often (no prizes for guessing that #citylis dominates!) and the users with whom I have had the most interactions.
WordPress
The other main facet of my self-expression this term has been this blog. Again looking at the most basic raw data, I can see that I have published 13 posts (not including this one), and that the blog has 33 followers, has been commented on 28 times (although many of these are my own pingbacks to previous posts), and has been viewed 898 times (this last figure is viewable by anyone as a widget at the foot of the page).
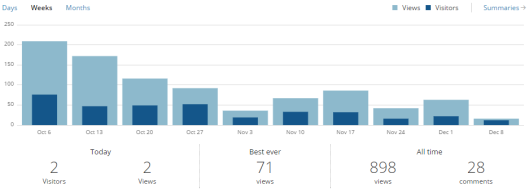
WordPress also provides an analytics page which allows bloggers to track metrics such as page views, referrals to the site, and links clicked on. So, for example, I can track the blog’s popularity over time, with reference to when I published certain posts (interestingly enough, the leanest period so far coincides with reading week!).
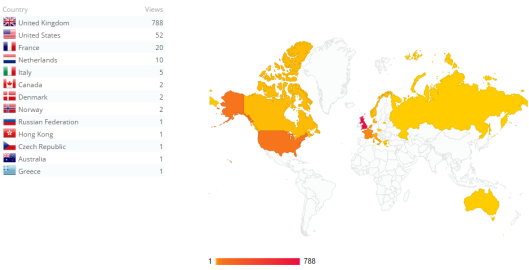
I can also see the global reach of the blog by viewing the geographical location by country of visitors displayed on a world map (I’m surprised by some of these!).
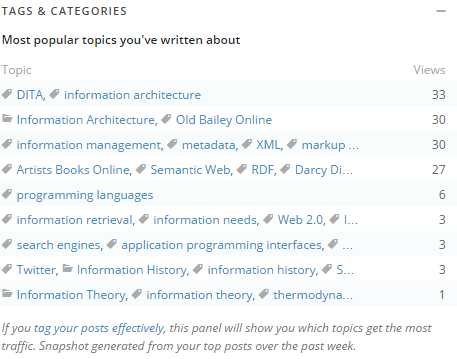
And as a final example, I can see which tags and categories are particularly possible. As with the Twitter case above, this could allow me to expand my readership as I could focus on the more interesting subjects. Unfortunately this feature only extends back one week.
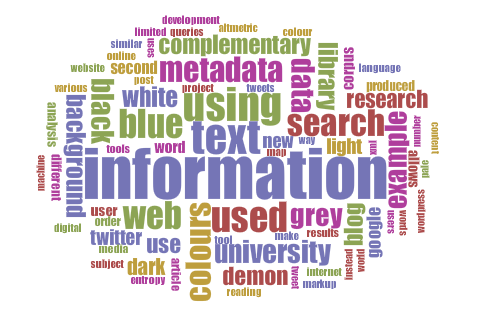
Unlike Twitter analytics, I cannot find a way to export this information for further analysis. However, I can copy-and-paste the content of each post to produce a Voyant word cloud.
Whilst “information” is unsurprisingly the dominant topic, the prominence of numerous colour-related terms is less immediately explainable, and requires me to think back to this early post on the blog’s design and colour scheme Similarly, anyone puzzled by the appearance of the word “demon” in a blog about Library and Information Science should refer to this post on information theory with special reference to Maxwell’s Demon. As ever, data mining and text analysis, understood as forms of “distant reading”, must be further investigated by close reading and an understanding of context, although they do provide good starting-points for research and identification of underlying patterns.
Conclusion
I have very much enjoyed using both Twitter and WordPress, and I believe that the examples above help to illustrate my engagement on the former platform, and my diverse range of readers and subjects covered on the latter. I have also enjoyed the module as a whole, despite not coming from a technical background: it has been extremely useful to understand the basic technological principles (and, stemming from them, the wider socio-cultural implications) that underlie the work of the contemporary information professional.
I will definitely keep this blog running, although I imagine that the posting schedule will become less frequent and regular, particularly with Christmas coming up and assignment deadlines looming. On the other hand, it may also begin to cover a wider range of material. I can imagine, for example, that the blogging process will be very helpful in organising my thoughts when it comes to writing my dissertation later in the academic year. For now, though, thanks for reading, and please stay tuned for further posts!
To finish with, here is some suitably reflective music for you to enjoy.

Enjoyed reading your blog over the past weeks. Hope you keep up the blogging in some form. I’m also planning to blog around my dissertation although how exactly that’ll work remains to be seen.
LikeLiked by 1 person
I too. have really enjoyed reading your blog. I look forward to reading some more in the future.
ps Enjoyed the Debussy, you’re a far classier guy than me, I currently have some drum and bass in my latest post!
LikeLiked by 1 person
I’ve also enjoyed reading your blog posts, not only because of how well written and knowledgeable they have been. I really don’t like Twitter, and I’m not really sure that I’ve enjoyed, so reading the blogs of somebody whose views and experience have been completely different to mine has been really interesting.
LikeLiked by 1 person
Your blog has been great. Always thought provoking, eclectic and very quick off the mark. I am glad yo are going to continue in future.
LikeLiked by 1 person
Pingback: Learning about LIS at City University London part II: two terms of blogging in review | The Library of Tomorrow
Anyone will find your post useful. Keep up the good work.
Self-reflection has been known to provide people a chance to look back at the things that have happened in the past. It is a great way for you to assess yourself in different aspects of life. Do you remember the last time you took the time to reflect on your life? If you haven’t been for a long time, then this blog Reasons to Make Time for Self-Reflection is for you.
LikeLike